Designing a Real-Time MLOps Observability Stack
Monitoring model drift, semantic hallucinations, token usage, and API latencies in production.

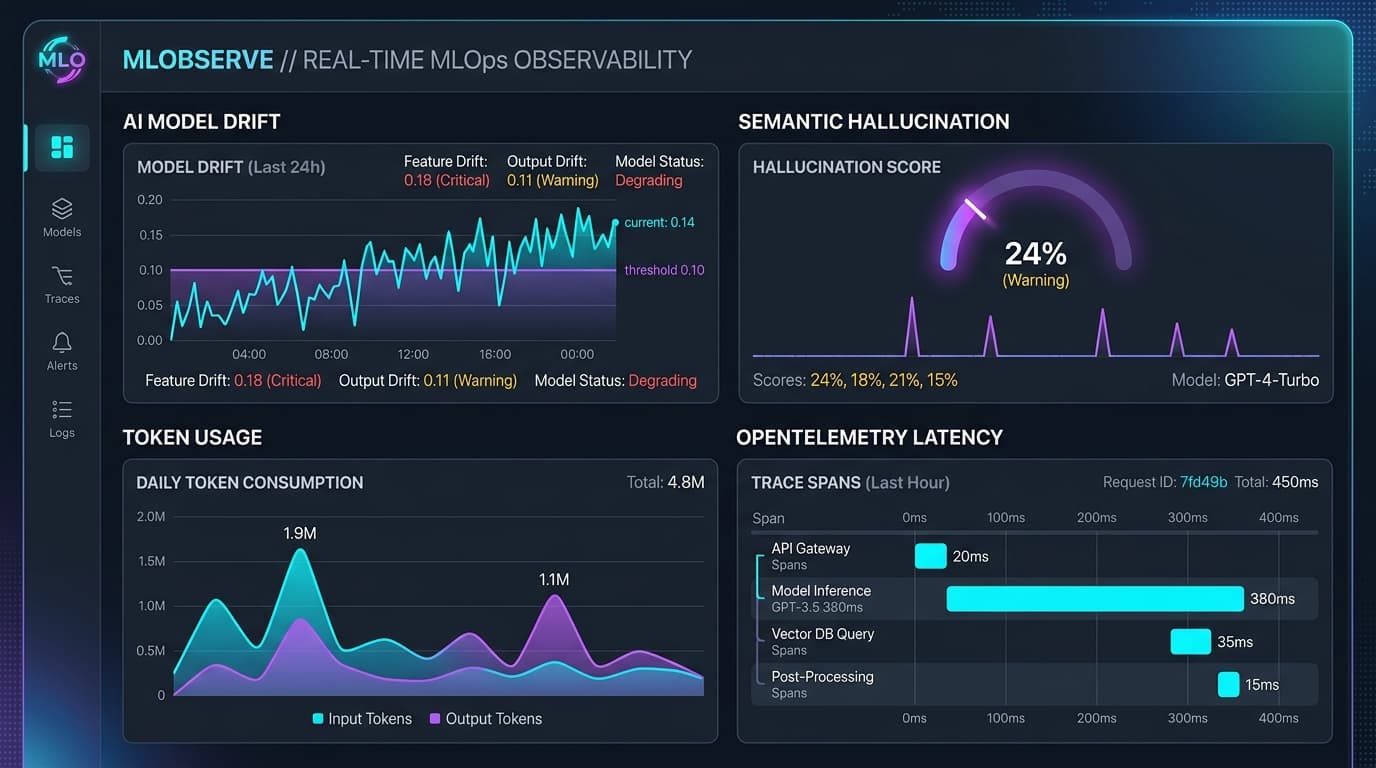
What Is It?
A Real-Time MLOps Observability Stack is an enterprise telemetry and evaluation engine designed to monitor non-deterministic machine learning and Generative AI applications in production environments. Unlike traditional Application Performance Monitoring (APM) tools (such as Datadog or New Relic) that focus primarily on system-level infrastructure metrics (CPU load, memory saturation, HTTP 500 status codes, and network throughput), an MLOps observability stack captures the behavioral, statistical, and semantic health of artificial intelligence pipelines.
Modern AI architectures integrate large language models (LLMs), dense vector retrievers, embedding generators, fine-tuned domain models, and multi-step autonomous agent graphs. In these complex systems, a software request can return an HTTP 200 OK status code while delivering complete misinformation, toxic content, or completely ungrounded facts to an end user. Traditional infrastructure monitoring is fundamentally blind to these semantic failures.
A production-grade MLOps observability stack provides a unified telemetry pipeline that correlates classic infrastructure health with specialized AI metrics:
- Semantic & Data Drift Monitoring: Continuous calculation of population stability indices, Kolmogorov-Smirnov statistics, and embedding vector distances between reference training data and live inference payloads.
- Hallucination & Groundedness Scoring: Asynchronous, online evaluation pipelines that score generated model completions against retrieved context documents and verified knowledge bases.
- Granular Token & FinOps Attribution: Real-time cost, prompt token, output token, and cached context tracking attributed by user tenant, model version, agent span, and application feature.
- End-to-End Distributed Tracing: Standardized trace spans utilizing OpenTelemetry GenAI semantic conventions to trace multi-agent graph invocations, vector database queries, and external tool calls.
By unifying OpenTelemetry collectors, columnar analytical stores like ClickHouse, time-series engines like Prometheus, and decoupled asynchronous scoring microservices, platform engineers gain full fidelity visibility into production AI deployments without introducing synchronous latency bottlenecks.
Why It Matters
Deploying machine learning models and LLM agentic applications to enterprise production without specialized observability introduces severe financial, operational, and reputational risks. Standard APM metrics treat AI endpoints as opaque black boxes, creating dangerous blind spots.
+-----------------------------------------------------------------------------------+
|                        TRADITIONAL APM vs MLOps OBSERVABILITY                     |
+-----------------------------------------------------------------------------------+
| Metric Category     | Traditional APM                | Real-Time MLOps Stack      |
+---------------------+--------------------------------+----------------------------+
| System Health       | CPU, RAM, Network I/O          | GPU VRAM, Tensor Utilization|
| Request Telemetry   | HTTP Status (200/500), Latency | TTFT, TPOT, Token Count    |
| Failure Detection   | Null Pointers, Exceptions      | Hallucination, Semantic Drift|
| Cost Attribution    | Compute Instance Hour          | Token FinOps per User/Agent|
| Data Integrity      | Schema Validation              | Embedding Distance Shift   |
+-----------------------------------------------------------------------------------+
1. The Cost of Silent Semantic Failures
In traditional web applications, bugs manifest as uncaught exceptions, crashed pods, or elevated error rates. In Generative AI systems, model degradation manifests silently. An agentic customer support bot might begin generating hallucinated discount codes or incorrect API instructions due to prompt injection attacks or retrieved context degradation. Without real-time hallucination evaluation and production LLM guardrails, these failures are only discovered when users complain or finance audits losses.
2. FinOps and Token Budget Saturation
LLM APIs operate on dynamic payload pricing. A single recursive agent loop or poorly formatted RAG prompt can explode context window utilization from 2,000 tokens to over 128,000 tokens per request. Without span-level token tracing, engineering teams face unexpected multi-thousand-dollar cloud bills. Real-time token tracking allows platform teams to enforce strict per-tenant rate limits and circuit breakers before budget caps are blown.
3. Concept Drift and Covariate Shift
Machine learning models trained on historical data inevitably decay as real-world distributions evolve. Covariate shift occurs when input features change over time, while concept drift occurs when the mathematical relationship between input features and target labels changes. Detecting drift in high-dimensional vector spaces requires continuous vector distance analysis rather than simple numerical schema validation.
4. Latency Decomposition for Multi-Step AI Graphs
In multi-agent systems, end-to-end user latency is composed of Time to First Token (TTFT), Time per Output Token (TPOT), vector database embedding retrieval time, and external tool execution. Isolating performance bottlenecks requires fine-grained span tracing. Using insights from speculative decoding token latency optimization, observability stacks isolate whether latency surges originate from model provider queueing, KV cache misses, or vector index degradation.
How It Works
A real-time MLOps observability stack operates across four synchronized execution layers: Instrumentation, Telemetry Streaming, Analytical Storage, and Asynchronous Evaluation.
+-----------------------------------------------------------------------------------+
|                   REAL-TIME MLOPS OBSERVABILITY PIPELINE ARCHITECTURE              |
+-----------------------------------------------------------------------------------+
|  [ AI Application / Agent Graph ]                                                 |
|          | (OpenTelemetry GenAI Spans)                                           |
|          v                                                                        |
|  [ OpenTelemetry Collector Buffer ]                                               |
|      /               \                                                            |
|     / (Metrics)       \ (Traces & Payloads)                                       |
|    v                   v                                                          |
|  [ Prometheus ]     [ Kafka / NATS Stream ]                                       |
|    (Alerts)            /              \                                           |
|                       v                v                                          |
|            [ ClickHouse Storage ]   [ Async Eval Worker Service ]                 |
|            (High-Fidelity Logs)     (LLM-as-a-Judge / Drift Math)                 |
|                                                |                                  |
|                                                +--> (Writes Quality Scores back)  |
+-----------------------------------------------------------------------------------+
1. Standardized OpenTelemetry GenAI Instrumentation
Application code is instrumented using standard OpenTelemetry SDKs extended with the GenAI Semantic Conventions. When an inference call or agent step executes, standard attributes are recorded on the active span:
gen_ai.system: Provider identifier (e.g.,openai,anthropic,vllm).gen_ai.request.model: Requested model name (e.g.,gpt-4o,claude-3-5-sonnet,llama-3.1-70b).gen_ai.usage.input_tokens: Count of prompt tokens consumed.gen_ai.usage.output_tokens: Count of completion tokens generated.gen_ai.completion.finish_reasons: Array containing stop conditions (stop,length,content_filter).
2. High-Throughput Telemetry Ingestion
Telemetry spans are exported asynchronously over gRPC to an OpenTelemetry Collector cluster. The collector uses batch processing and memory-limiter queues to prevent telemetry ingestion from impacting application response times.
From the collector, telemetry data is split into two primary streams:
- Prometheus Exporter: Extracts aggregated counters and histograms (token rates, error counts, latency distributions) for instant dashboarding and alerting.
- Kafka / NATS Message Queue: Streams full trace payloads, including complete prompt texts, output completions, and vector embeddings, into durable storage and evaluation queues.
3. Columnar Storage in ClickHouse
Full-fidelity trace events and raw prompt payloads are written to a ClickHouse columnar database cluster. ClickHouse allows querying billions of high-cardinality AI events with sub-second SQL performance. By indexing on tenant ID, trace ID, model version, and timestamp, platform teams can run deep forensic analyses across terabytes of prompt history.
4. Asynchronous Online Evaluation (LLM-as-a-Judge & Drift Math)
To measure semantic quality without blocking application execution, an Async Eval Worker Service consumes trace events from the message queue. For a sampled percentage of production traffic (e.g., 10% to 20%), the worker runs specialized evaluation algorithms:
- Groundedness / Faithfulness: Verifying that statement claims in the generated output are strictly supported by the retrieved RAG context documents.
- Answer Relevance: Measuring vector cosine similarity between the user query embedding and generated response embedding.
- Statistical Drift (PSI & KS-Test): Computing statistical divergence between incoming prompt vector embeddings and reference baseline datasets stored during training.
The resulting quality scores are re-attached to the original trace record in ClickHouse and pushed to Prometheus as custom metrics.
Architecture
Building an enterprise-ready MLOps observability stack requires selecting purpose-built components for each layer of the telemetry lifecycle.
Telemetry Pipeline Component Comparison
| Layer | Recommended Technology | Alternative Option | Primary Strengths | Strategic Tradeoff |
|---|---|---|---|---|
| Instrumentation | OpenTelemetry GenAI SDK | Langfuse / LangSmith SDK | Vendor-neutral, native SRE integration | Requires custom semantic attribute mapping |
| Telemetry Ingestion | OpenTelemetry Collector | Vector / FluentBit | High throughput, native OTLP routing | Higher memory footprint under heavy bursts |
| Streaming Queue | Apache Kafka | NATS JetStream | Event replay capability, massive scale | Requires dedicated Zookeeper/KRaft management |
| Trace Storage | ClickHouse | ElasticSearch | 10x compression, sub-second analytical SQL | Schema design requires strict partitioning |
| Time-Series Metrics | Prometheus | VictoriaMetrics | Standard alerting engine, native Grafana | High memory usage for massive cardinality |
| Online Evaluation | Custom Python Async Service | Braintrust / Arize Phoenix | Full control over eval prompts & costs | Operational overhead of scaling eval workers |
OpenTelemetry GenAI Span Implementation
Below is a production-grade TypeScript implementation for instrumenting an LLM inference request with complete OTel GenAI semantic attributes, latency breakdown, and token usage:
import { trace, SpanStatusCode, getCurrentBaggage } from "@opentelemetry/api";
import { OTLPTraceExporter } from "@opentelemetry/exporter-trace-otlp-grpc";

const tracer = trace.getTracer("mlops-observability-agent", "2.4.0");

interface LLMRequestPayload {
  model: string;
  prompt: string;
  maxTokens: number;
  tenantId: string;
}

interface LLMResponsePayload {
  text: string;
  inputTokens: number;
  outputTokens: number;
  finishReason: string;
}

export async function executeObservedLLMCall(
  payload: LLMRequestPayload,
  llmApiCall: (p: LLMRequestPayload) => Promise<LLMResponsePayload>
): Promise<LLMResponsePayload> {
  return tracer.startActiveSpan("gen_ai.completion", async (span) => {
    const startTime = performance.now();

    // Set standard OTel GenAI attributes
    span.setAttribute("gen_ai.system", "vllm");
    span.setAttribute("gen_ai.request.model", payload.model);
    span.setAttribute("gen_ai.request.max_tokens", payload.maxTokens);
    span.setAttribute("app.tenant_id", payload.tenantId);

    // Log prompt content (optional based on PII governance)
    span.setAttribute("gen_ai.prompt.0.role", "user");
    span.setAttribute("gen_ai.prompt.0.content", payload.prompt.substring(0, 1000));

    try {
      const response = await llmApiCall(payload);
      const executionTimeMs = performance.now() - startTime;

      // Set response telemetry attributes
      span.setAttribute("gen_ai.usage.input_tokens", response.inputTokens);
      span.setAttribute("gen_ai.usage.output_tokens", response.outputTokens);
      span.setAttribute("gen_ai.usage.total_tokens", response.inputTokens + response.outputTokens);
      span.setAttribute("gen_ai.completion.0.finish_reason", response.finishReason);
      span.setAttribute("gen_ai.completion.0.content", response.text.substring(0, 1000));
      span.setAttribute("gen_ai.latency.total_ms", executionTimeMs);

      // Calculate tokens per second speed metric
      if (response.outputTokens > 0) {
        const tpot = executionTimeMs / response.outputTokens;
        span.setAttribute("gen_ai.latency.time_per_output_token_ms", tpot);
      }

      span.setStatus({ code: SpanStatusCode.OK });
      return response;
    } catch (error: any) {
      span.setStatus({
        code: SpanStatusCode.ERROR,
        message: error?.message || "LLM Execution Failure",
      });
      span.recordException(error);
      throw error;
    } finally {
      span.end();
    }
  });
}
ClickHouse Analytical Schema for AI Traces
To store millions of trace records efficiently, ClickHouse uses the ReplacingMergeTree or MergeTree engine partitioned by month and indexed by tenant and timestamp:
CREATE TABLE IF NOT EXISTS mlops_telemetry.llm_traces
(
    trace_id String,
    span_id String,
    parent_span_id String,
    timestamp DateTime64(3, 'UTC'),
    tenant_id LowCardinality(String),
    model_name LowCardinality(String),
    provider LowCardinality(String),
    input_tokens UInt32,
    output_tokens UInt32,
    total_cost_usd Float64,
    latency_ms Float64,
    time_to_first_token_ms Float64,
    prompt_text String,
    completion_text String,
    hallucination_score Float32,
    groundedness_score Float32,
    vector_embedding Array(Float32),
    finish_reason LowCardinality(String),
    status_code LowCardinality(String)
)
ENGINE = MergeTree()
PARTITION BY toYYYYMM(timestamp)
ORDER BY (tenant_id, model_name, timestamp, trace_id)
TTL timestamp + INTERVAL 90 DAY;
Production Deployment Considerations
Deploying a real-time MLOps observability stack in production requires managing network bandwidth, PII privacy compliance, compute overhead, and storage scaling.
+-----------------------------------------------------------------------------------+
|                  PRODUCTION DEPLOYMENT HARDENING CHECKLIST                       |
+-----------------------------------------------------------------------------------+
| Component      | Hardening Strategy                                               |
+----------------+------------------------------------------------------------------+
| Telemetry      | Asynchronous background batching via gRPC non-blocking channels  |
| Privacy        | Regex PII scrubbing (SSN, Email, Credit Cards) inside OTel edge  |
| Storage        | Partition ClickHouse tables by YYYYMM with 90-day TTL policy     |
| FinOps         | Sub-cent precision cost calculation using model price matrix    |
| Evaluation     | Asynchronous Kafka queue with 10% adaptive sampling worker pool  |
+-----------------------------------------------------------------------------------+
1. PII Scrubbing and Governance at the Edge
Writing raw prompts and user inputs to trace backends creates significant data privacy risks under GDPR, HIPAA, and SOC2 guidelines. PII sanitization must occur in memory inside the OpenTelemetry Collector using the transform processor before data reaches persistent disks:
processors:
  transform:
    error_mode: ignore
    trace_statements:
      - context: span
        statements:
          - replace_all_patterns(attributes, "value", "gen_ai.prompt.*.content", "[EMAIL]", "[a-zA-Z0-9._%+-]+@[a-zA-Z0-9.-]+\\.[a-zA-Z]{2,}")
          - replace_all_patterns(attributes, "value", "gen_ai.prompt.*.content", "[SSN]", "\\b\\d{3}-\\d{2}-\\d{4}\\b")
For applications requiring complete data privacy compliance, inspect prompt injection mitigation sanitization defenses to align telemetry scrubbing with security boundaries.
2. FinOps Precision and Token Cost Tracking
Models possess radically different token pricing models. For instance, fine-tuned models or reasoning models charge different rates for input tokens, output tokens, and cached tokens. Observability pipelines must maintain a dynamic lookup pricing table:
Token Cost (USD) = (Input Tokens * Price_Input) + (Output Tokens * Price_Output) + (Cache Miss Tokens * Price_Cache)
By calculating exact per-request costs in ClickHouse, engineering leaders can monitor profit margins across multi-tenant SaaS features in real time.
Common Mistakes
Engineering teams frequently make critical mistakes when transitioning from standard web application monitoring to MLOps observability.
1. Running Synchronous LLM-as-a-Judge in the Hot Path
The most severe mistake is invoking evaluation models synchronously inside the primary API request loop. Calling a judge model (such as GPT-4o) to evaluate an application output adds 1.5 to 3.0 seconds of latency to user requests. Evaluation must always run asynchronously via message queues.
2. Storing Full High-Dimensional Vector Embeddings in Prometheus
Prometheus is designed for low-cardinality scalar time-series metrics. Attempting to push raw 1536-dimensional float vector embeddings or unique prompt text strings into Prometheus metric labels will immediately exhaust TSDB index memory, resulting in out-of-memory container crashes. High-cardinality vector payload data belongs strictly in ClickHouse or dedicated vector storage engines analyzed alongside vector database indexing and latency profiling.
3. Monitoring Raw Output Text Instead of Semantic Vector Shifts
Relying on exact string matching or simple regex filters to detect model degradation fails completely in Generative AI. LLM completions vary in phrasing, word choice, and structure while preserving identical meaning. Observability must monitor mathematical embedding centroid distance rather than exact text strings.
4. Ignoring Retries and Gateway Failover Overhead
When primary model providers experience outages or rate limits, intelligent gateways automatically fail over to fallback models. If observability spans fail to capture internal retry attempts, latency metrics will show unexplained spikes while token costs will double without visible user traffic increases.
Lessons From Production Deployments
Analyzing production incident reports across enterprise MLOps teams reveals critical operational lessons learned when managing large-scale AI observability pipelines.
+-----------------------------------------------------------------------------------+
|                    REAL-WORLD PRODUCTION INCIDENT LESSONS                         |
+-----------------------------------------------------------------------------------+
| Incident Scenario               | Root Cause               | Mitigation Strategy   |
+---------------------------------+--------------------------+-----------------------+
| Unexplained Latency Spike       | Missing Span Retries     | Track gateway retry   |
|                                 |                          | attempt counters      |
| Sudden FinOps Budget Surge      | Recursive Agent Loop     | Enforce max step spans|
|                                 |                          | & circuit breakers    |
| Prometheus Out-Of-Memory Crash  | Unbounded Metric Labels  | Strip prompt strings  |
|                                 |                          | from SRE metrics      |
| False Positives on Model Drift  | Seasonal Domain Shift    | Use rolling baseline  |
|                                 |                          | reference windows     |
+-----------------------------------------------------------------------------------+
1. The Recursive Agent Infinite Loop Incident
A multi-agent customer support workflow deployed at a major fintech company suffered a recursive loop bug where two specialized agent nodes repeatedly queried each other to resolve an ambiguous user intent. Because traditional APM monitored only HTTP endpoint entry points, the background agent loop executed for 45 minutes before hitting a gateway timeout, consuming 8.4 million tokens on a single user session.
Lesson Learned: Implement span-level depth counters (gen_ai.agent.depth) and configure automated circuit breakers that terminate execution when an agent span tree exceeds 15 nested steps.
2. High-Cardinality Prometheus Outage
During a major marketing event, an engineering team logged raw user prompt strings as a prompt_text label in Prometheus metric counters to build a real-time word cloud. Within 12 minutes, the metric cardinality exploded to over 4 million unique series, triggering a catastrophic Prometheus Out-of-Memory (OOM) crash that took down alerting across the entire infrastructure.
Lesson Learned: Strictly decouple SRE metrics from payload logging. Pass high-cardinality attributes exclusively to ClickHouse via OTLP traces.
3. Continuous Retraining Pipeline Trigger Loops
An enterprise recommendation system configured automated model retraining whenever Kolmogorov-Smirnov feature drift exceeded a 0.05 threshold. During a holiday sale, natural shifts in user purchasing behavior triggered the drift alert, initiating automated retraining jobs every 3 hours. The retraining jobs consumed massive GPU cluster capacity and generated inaccurate models trained on temporary holiday noise. Integrating workflows with automated ML retraining pipelines prevents false retraining loops.
Lesson Learned: Replace fixed static drift thresholds with sliding 30-day baseline reference windows and require dual verification (feature drift + business KPI drop) before firing automated retraining pipelines.
What Most Articles Miss
Most MLOps tutorials discuss basic model drift and token counters while failing to address the complex mathematical and architectural realities of enterprise AI telemetry.
1. The Mathematics of Data & Feature Drift: PSI vs. KS-Test
Measuring numerical feature drift requires selecting appropriate statistical algorithms based on variable distributions.
Population Stability Index (PSI)
PSI measures the shift in distribution between a reference baseline dataset (e.g., training data) and an actual production dataset across binned intervals:
PSI = \sum ((Actual_i - Expected_i) * ln(Actual_i / Expected_i))
Where:
Actual_i: Percentage of production observations in bini.Expected_i: Percentage of baseline training observations in bini.
Interpretation Rules:
PSI < 0.10: No significant distribution shift; model is stable.0.10 <= PSI < 0.25: Moderate shift; requires monitoring and investigation.PSI >= 0.25: Severe distribution shift; model retraining required immediately.
Kolmogorov-Smirnov (KS) Two-Sample Test
For continuous variables, the KS test measures the maximum vertical distance D between the Empirical Cumulative Distribution Functions (ECDF) of two samples:
D = \sup_x | F_1(x) - F_2(x) |
Where F_1(x) and F_2(x) represent the empirical cumulative distributions of reference and production datasets. If the calculated p-value drops below 0.01, the hypothesis that both samples come from the same distribution is rejected.
2. Embedding Vector Centroid Drift
LLMs process input prompts and generate output completions in high-dimensional vector spaces. Standard scalar drift metrics fail to capture semantic shift. To track semantic drift:
- Generate embedding vectors
E_ifor incoming production prompts using a fixed reference embedding model. - Compute the running centroid vector
C_prodof the production stream:
C_prod = (1 / N) * \sum_{i=1}^{N} E_i
- Calculate the Cosine Distance between the production centroid
C_prodand baseline training centroidC_base:
Cosine_Distance = 1 - ( (C_prod . C_base) / ( ||C_prod|| * ||C_base|| ) )
When Cosine_Distance exceeds 0.15, it indicates that incoming user queries have shifted into a new semantic domain not covered during model alignment or RAG indexing.
import numpy as np

def calculate_psi(expected: np.ndarray, actual: np.ndarray, num_bins: int = 10) -> float:
    """
    Computes the Population Stability Index (PSI) between baseline and production samples.
    """
    # Create bin edges based on expected distribution
    percentiles = np.linspace(0, 100, num_bins + 1)
    bin_edges = np.percentile(expected, percentiles)

    # Adjust boundaries to prevent edge errors
    bin_edges[0] -= 1e-5
    bin_edges[-1] += 1e-5

    # Calculate counts in each bin
    expected_counts, _ = np.histogram(expected, bins=bin_edges)
    actual_counts, _ = np.histogram(actual, bins=bin_edges)

    # Convert to fractions with epsilon smoothing to avoid division by zero
    eps = 1e-4
    expected_pct = (expected_counts + eps) / (len(expected) + eps * num_bins)
    actual_pct = (actual_counts + eps) / (len(actual) + eps * num_bins)

    # Compute PSI formula
    psi_value = np.sum((actual_pct - expected_pct) * np.log(actual_pct / expected_pct))
    return float(psi_value)

def calculate_vector_centroid_drift(baseline_embeddings: np.ndarray, production_embeddings: np.ndarray) -> float:
    """
    Calculates Cosine Distance between baseline and production vector centroids.
    """
    centroid_base = np.mean(baseline_embeddings, axis=0)
    centroid_prod = np.mean(production_embeddings, axis=0)

    norm_base = np.linalg.norm(centroid_base)
    norm_prod = np.linalg.norm(centroid_prod)

    if norm_base == 0 or norm_prod == 0:
        return 0.0

    cosine_similarity = np.dot(centroid_base, centroid_prod) / (norm_base * norm_prod)
    cosine_distance = 1.0 - cosine_similarity
    return float(cosine_distance)
3. Asynchronous Hallucination Scoring via Faithfulness Prompts
Evaluating whether a model completion hallucinated facts requires structured LLM-as-a-Judge prompting against retrieved RAG context. The evaluation service extracts individual claims from the completion and verifies each against context documents:
[System Prompt]
You are a rigorous factual evaluation auditor. Analyze the provided Context Documents and Statement Claim.
Determine if the Statement Claim is strictly supported by the Context Documents.

Context Documents:
{retrieved_context}

Statement Claim:
{claim_text}

Output JSON Format:
{
  "supported": true | false,
  "confidence": 0.0 to 1.0,
  "reasoning": "Detailed justification"
}
The overall Faithfulness Score is calculated as the ratio of supported claims to total extracted claims:
Faithfulness Score = Supported Claims / Total Extracted Claims
For deeper insights into benchmark scoring datasets, review RAG evaluation framework design to align production evals with offline testing.
Best Practices
Building a resilient, high-performing MLOps observability stack requires adhering to proven engineering principles.
1. Adopt OpenTelemetry GenAI Semantic Conventions Standard
Avoid proprietary vendor lock-in by implementing vendor-neutral OpenTelemetry instrumentation. Ensure all application trace spans emit standardized gen_ai.* attributes. This guarantees seamless migration across ClickHouse, Datadog, Langfuse, or custom telemetry backends.
2. Decouple Telemetry Ingestion from Application Threads
Never execute telemetry HTTP requests or evaluation scoring synchronously within user-facing API threads. Export traces over non-blocking gRPC channels to an edge OpenTelemetry Collector and process heavy evaluations asynchronously via Kafka queues.
3. Implement Adaptive Dynamic Sampling for LLM Evals
Running LLM-as-a-Judge evaluations on 100% of production traffic is prohibitively expensive. Implement adaptive sampling strategies:
- Sample 100% of failed requests (HTTP status non-200 or finish reason
length). - Sample 100% of high-cost requests (total tokens > 8,000).
- Sample 5% to 10% of standard successful requests for baseline quality monitoring.
4. Establish Unified Prometheus Alert Rules
Configure automated alerting rules for critical SRE thresholds, token spend spikes, and quality drops:
groups:
  - name: mlops_observability_alerts
    rules:
      - alert: HighLLMHallucinationRate
        expr: avg_over_time(gen_ai_faithfulness_score[15m]) < 0.80
        for: 5m
        labels:
          severity: critical
        annotations:
          summary: "LLM Faithfulness score dropped below 80%"
          description: "Production hallucination score for model {{ $labels.model_name }} is currently {{ $value }}."

      - alert: TokenSpendRateSpike
        expr: sum(rate(gen_ai_token_cost_usd_total[5m])) * 3600 > 250
        for: 2m
        labels:
          severity: warning
        annotations:
          summary: "Hourly token cost burn rate exceeded $250/hr"
          description: "Tenant {{ $labels.tenant_id }} is generating excessive token volume."
5. Benchmark Performance and Model Drift Simultaneously
Correlate operational inference speed metrics—such as Time to First Token (TTFT) and Time per Output Token (TPOT)—with semantic drift metrics. If model speed degrades alongside rising embedding distance, it indicates KV cache thrashing caused by out-of-domain user prompts. Benchmark deployments against open weights using techniques outlined in deploying open weights Gemma 2 vs Llama 3 vs Qwen 2.5.
FAQ
1. What is the difference between traditional APM and MLOps observability?
Traditional APM monitors system infrastructure health (CPU, RAM, HTTP status codes, network latency). MLOps observability monitors model behavioral, statistical, and semantic health (model drift, hallucination rates, token usage, groundedness, and prompt context accuracy).
2. Why should we use OpenTelemetry GenAI semantic conventions instead of custom logging?
OpenTelemetry GenAI conventions provide a vendor-neutral standardized telemetry schema. Adopting OTel prevents vendor lock-in, allowing engineering teams to route traces and metrics to any backend (ClickHouse, Datadog, Prometheus, Langfuse) without rewriting application code.
3. Does real-time hallucination tracking add latency to user requests?
No. In a properly designed architecture, hallucination evaluation runs fully asynchronously. Traces are pushed to message queues (such as Kafka), where background worker services execute LLM-as-a-Judge evaluations without delaying user response times.
4. How is model drift calculated for high-dimensional vector embeddings?
Vector embedding drift is calculated by computing the running centroid of production prompt embeddings and measuring the Cosine Distance or Euclidean Distance between the production centroid and a reference baseline training centroid.
5. What statistical test is best for continuous feature drift detection?
The Kolmogorov-Smirnov (KS) two-sample test is ideal for continuous feature variables, as it compares empirical cumulative distribution functions. Population Stability Index (PSI) is preferred for binned categorical or numerical distributions.
6. How can engineering teams control the cost of LLM-as-a-Judge evaluations?
Teams control costs by implementing adaptive sampling (evaluating 5% to 10% of successful requests and 100% of errors), using smaller distilled evaluation models (such as 8B parameter models), and caching repeated prompt claim evaluations.
7. What is Time to First Token (TTFT) and why is it critical?
TTFT measures the time elapsed between sending a request and receiving the first generated token. It reflects prefill processing speed, prompt token processing efficiency, and initial model queue latency.
8. How does ClickHouse complement Prometheus in an MLOps stack?
Prometheus stores aggregated low-cardinality time-series metrics for real-time alerting and Grafana dashboards. ClickHouse stores high-cardinality full-fidelity trace logs, raw prompt texts, completions, and vector embeddings for deep SQL forensic debugging.
9. How should PII be scrubbed in an MLOps observability pipeline?
PII (emails, social security numbers, credit cards) should be scrubbed in memory using regular expression transformation processors inside the edge OpenTelemetry Collector before traces are written to persistent databases.
10. How do multi-agent workflows complicate distributed tracing?
Multi-agent workflows involve nested, non-linear execution graphs with asynchronous tool calls and recursive feedback loops. Tracing requires maintaining parent-child span context propagations (traceparent) across agent boundaries to visualize complete execution trees.
Key Takeaways
- Semantic Failures Are Silent: AI applications can return HTTP 200 OK responses while delivering completely hallucinated, inaccurate, or toxic outputs. Dedicated MLOps observability is essential to detect quality degradation.
- Standardize on OpenTelemetry GenAI Conventions: Instrument application pipelines using vendor-neutral
gen_ai.*semantic attributes to ensure full telemetry portability across observability backends. - Decouple Evaluation from the Hot Path: Never execute LLM-as-a-Judge or hallucination scoring synchronously inside request handlers. Stream trace events via Kafka to asynchronous evaluation workers.
- Unify ClickHouse and Prometheus: Use Prometheus for low-cardinality real-time metric alerting, and ClickHouse for high-cardinality full-fidelity storage of prompts, completions, and vector embeddings.
- Combine Scalar and Vector Drift Analytics: Compute Population Stability Index (PSI) for binned features, Kolmogorov-Smirnov tests for continuous variables, and Cosine Centroid Distance for high-dimensional vector embeddings.
- Enforce FinOps and Circuit Breakers: Track span-level token consumption and request costs in real time. Implement automated circuit breakers to terminate recursive agent loop bugs before cloud budgets are exhausted.